

By Craig Idso, American Thinker
In a Wall Street Journal opinion article published on August 6, 2012, Fred Krupp, president of the Environmental Defense Fund, issued an appeal calling for a new climate-change consensus among climate alarmists (those who believe society’\’s burning of fossil fuels is causing modern-day global warming and who are alarmed at its potential climatic consequences) and climate skeptics (those who consider that mankind’s contribution to present and future climate, if any, will be mostly benign).
To jump start this proposed alliance, Krupp asks that both sides of the debate agree to two “"basic truths” so that a “bipartisan, multi-stakeholder plan of action” can be implemented “to safeguard the natural systems on which our economic future depends.”
The first of these so-called truths is that “dramatic alterations to the climate are here and likely to get worse - with profound resultant damage to the economy - unless sustained action is taken.” His choice of sources to support this claim, however, is pitiful. He cites a non-peer-reviewed, editorialized story from the Economist that blames CO2-induced global warming for melting the Arctic, and a yet-to-be published scientific study that claims ‘climate change is ‘almost entirely’ due to greenhouse-gas pollution.” Then, after philosophizing a bit as to why skeptics think the way they do on this issue, he proceeds with an appeal to authority, citing statements from two Republican Governors who think the climate is indeed changing due to rising greenhouse gases, along with the results of a political poll on global warming beliefs, which suggests that a majority of the respondents feel it is human-caused. Yet, if there is any human enterprise that should be free of appeal to authority, it is science, where observation and impartial analysis are supposed to reign supreme.
In considering Mr. Krupp’s first “truth”—that dramatic alterations to the climate are here to stay and will be amplified in the future—it is clear that he could benefit from an old-fashioned review of the pertinent scientific literature, and not just the science that has been selectively edited by the United Nations’ Intergovernmental Panel on Climate Change, but the voluminous science that has appeared in a vast array of peer-reviewed publications that runs counter to the assertions presented in his first “truth” (see, for example, the thousands of peer-reviewed journal articles that are referenced by the Nongovernmental International Panel on Climate Change at www.nipccreport.org).
If Mr. Krupp truly studied these materials, he would learn there is nothing unusual, unnatural or unprecedented about Earth’s current climate. He would learn, for example, that although the world has warmed substantially over the past century or more, real-world data demonstrate that none of the environmental catastrophes that are predicted by climate alarmists to be produced by such a warming has come to pass. He would also learn that the climate of the Arctic is highly variable, and that temperatures were as warm there in the 1930s as they are currently. And he would learn that temperatures in the Antarctic have remained stable, that sea ice in the Southern Hemisphere has expanded equator-ward, that the planet’s great ice sheets are not in danger of collapse, that present-day storms, drought, floods, hurricanes, heat waves and other extreme weather phenomena are not exceptional within the context of the past 2000 years. Most importantly, he would learn that carbon dioxide is not a pollutant, but a precious life-giving and life-sustaining molecule to which we all owe our very existence, and from which we will continue to benefit as it rises in the future by increasing global crop yields, among other remunerations (see The Many Benefits of Atmospheric CO2 Enrichment).
With respect to the second of the two “truths” that Krupp attempts to sell us, he encourages everyone to accept that “some proposed climate solutions, if not well designed or thoughtfully implemented, could damage the economy and stifle short-term growth.” But this feigned attempt at compromise with the world’s climate skeptics presupposes that there is indeed a climate problem to be solved. Real-world data, however, suggest otherwise.
The best policy when it comes to emissions of carbon dioxide is to let well enough alone. The Industrial Revolution has been a tremendous boon to humanity, as it has lifted large numbers of mankind from poverty to prosperity. And the increase in the atmosphere’s carbon dioxide concentration that has accompanied it has likewise significantly increased the productivity of farmers the world over, thanks to its aerial-fertilization and water-use-efficiency enhancing effects.
Clearly, fossil-fuel-derived energy has served us well in the past, and it will serve us well in the future. Letting nature and the market place take their unimpeded courses is the path of prudence that will bring unbounded prosperity to generations yet unborn in every corner of the globe.
Dr. Craig D. Idso is Chairman, Center for the Study of Carbon Dioxide and Global Change
Quote of the Week - WUWT
Senator Harry Reid’s Press Release: Time To Stop Acting Like Climate Change Deniers Have A Valid Point Of View - They Don’t
“If skeptics had taken a stroll along Potomac River on a 70-degree day this Feb., they would have seen cherry trees blossoming earlier than at any time since they were planted 100 years ago”
Umm, no. Let’s go to the data.

Japanese cherry trees (Sakura), a gift from Japan in 1965, adorn the Tidal Basin in Washington, D.C. during the National Cherry Blossom Festival. The Washington Monument is visible in the distance. (Photo credit: Wikipedia)
Correction for Reid: Both 1990 and 2000 had earlier blooms:
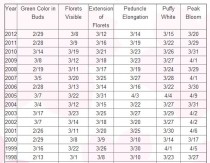
The National Park Service (NPS) has confirmed Washington, D.C.’s cherry blossoms peaked on March 20, tied for third earliest on record.
In the NPS’s 92-year record dating back to 1921, the only years with earlier bloom dates were 1990 (March 15) and 2000 (March 17) . Three other years in the record matched this year’s peak bloom date of March 20: 1921, 1927, and 1945.
You’d think with a well paid staff at his disposal, Senator Reid could at least do some fact checking before bloviating about how “deniers” have no valid point of view.
How embarrassing it must be that we mere bloggers have to point out his factual gaffes he and his staff miss.
[UPDATE: My friend, nationally syndicated radio show talk host Lars Larson has the ultimate zinger for this where he says:
You know, I think this qualifies Senator Reid of Nevada as an official “Blooming Idiot”. ]
Here is Senator James Inhofe’s Press Release on Reid’s announcement:
“He says ‘the time to act is now” - yet Reid hasn’t brought a cap-and-trade bill to floor since 2008, & he’s the one who said cap-and-trade had been deleted from his dictionary”
“If it’s time to act on anything, it would be to stop President Obama from implementing these global warming policies that the American people have clearly rejected”
Perhaps the title should have been: Time To Stop Acting Like Senator Reid Has A Valid Point Of View on Global Warming - He Doesn’t
By Dr. Roger Pielke Sr., Climate Science
UPDATE #2: To make sure everyone clearly recognizes my involvement with both papers, I provided Anthony suggested text and references for his article [I am not a co-author of the Watts et al paper], and am a co-author on the McNider et al paper.
UPDATE: There has been discussion as to whether the Time of Observation Bias (TOB) could affect the conclusions reached in Watts et al (2012). This is a valid concern. Thus the “Game Changing” finding of whether the trends are actually different for well- and poorly-sited locations is tenative until it is shown whether or not TOB alters the conclusions. The issue, however, is not easy to resolve. In our paper
Pielke Sr., R.A., T. Stohlgren, L. Schell, W. Parton, N. Doesken, K. Redmond, J. Moeny, T. McKee, and T.G.F. Kittel, 2002: Problems in evaluating regional and local trends in temperature: An example from eastern Colorado, USA. Int. J. Climatol., 22, 421-434.
this is what we concluded [highlight added]
The time of observation biases clearly are a problem in using raw data from the US Cooperative stations. Six stations used in this study have had documented changes in times of observation. Some stations, like Holly, have had numerous changes. Some of the largest impacts on monthly and seasonal temperature time series anywhere in the country are found in the Central Great Plains as a result of relatively frequent dramatic interdiurnal temperature changes. Time of observation adjustments are therefore essential prior to comparing long-term trends.
We attempted to apply the time of observation adjustments using the paper by Karl et al. (1986). The actual implementation of this procedure is very difficult, so, after several discussions with NCDC personnel familiar with the procedure, we chose instead to use the USHCN database to extract the time of observation adjustments applied by NCDC. We explored the time of observation bias and the impact on our results by taking the USHCN adjusted temperature data for 3 month seasons, and subtracted the seasonal means computed from the station data adjusted for all except time of observation changes in order to determine the magnitude of that adjustment. An example is shown here for Holly, Colorado (Figure 1), which had more changes than any other site used in the study.
What you would expect to see is a series of step function changes associated with known dates of time of observation changes. However, what you actually see is a combination of step changes and other variability, the causes of which are not all obvious. It appeared to us that editing procedures and procedures for estimating values for missing months resulted in computed monthly temperatures in the USHCN differing from what a user would compute for that same station from averaging the raw data from the Summary of the Day Cooperative Data Set. This simply points out that when manipulating and attempting to homogenize large data sets, changes can be made in an effort to improve the quality of the data set that may or may not actually accomplish the initial goal.
Overall, the impact of applying time of observation adjustment at Holly was to cool the data for the 1926-58 with respect to earlier and later periods. The magnitude of this adjustment of 2C is obviously very large, but it is consistent with changing from predominantly late afternoon observation times early in the record to early morning observation times in recent years in the part of the country where time of observation has the greatest effect. Time of observation adjustments were also applied at five other sites.
Until this issue is resolved, the Game Changer aspect of the Watts et al 2012 study is tenative. [Anthony reports he is actively working to resolve this issue on hold ]. The best way to address the TOB issue is to use data from sites in the Watts et al data set that have hourly resolution. For those years, when the station is unchanging in location, compute the TOB. The Karl et al (1986) method of TOB adjustment, in my view, needs to be more clearly defined and further examined in order to better address this issue. I understand research is underway to examine the TOB issue in detail, and results will be reported by Anthony when ready.
--------
There are two recent papers that raise serious questions on the accuracy of the quantitative diagnosis of global warming by NCDC, GISS, CRU and BEST based on land surface temperature anomalies. These papers are a culmination of two areas of uncertainty study that were identified in the paper
Pielke Sr., R.A., C. Davey, D. Niyogi, S. Fall, J. Steinweg-Woods, K. Hubbard, X. Lin, M. Cai, Y.-K. Lim, H. Li, J. Nielsen-Gammon, K. Gallo, R. Hale, R. Mahmood, S. Foster, R.T. McNider, and P. Blanken, 2007: Unresolved issues with the assessment of multi-decadal global land surface temperature trends. J. Geophys. Res., 112
The Summary
One paper [Watts et al 2012] show that siting quality does matter. A warm bias results in the continental USA when poorly sited locations are used to construct a gridded analysis of land surface temperature anomalies.
The other paper [McNider et al 2012] shows that not only does the height at which minimum temperature observations are made matter, but even slight changes in vertical mixing (such as from adding a small shed near the observation site, even in an otherwise pristine location) can increase the measured temperature at the height of the observation. This can occur when there is little or no layer averaged warming.
The Two Papers
Watts et al, 2012: An area and distance weighted analysis of the impacts of station exposure on the U.S. Historical Climatology Network temperatures and temperature trends [to be submitted to JGR]
McNider, R. T., G.J. Steeneveld, B. Holtslag, R. Pielke Sr, S. Mackaro, A. Pour Biazar, J. T. Walters, U. S. Nair, and J. R. Christy (2012). Response and sensitivity of the nocturnal boundary layer over land to added longwave radiative forcing, J. Geophys. Res. in press. [for the complete paper, click here]
To Provide Context
First, however, to make sure that my perspective on climate is properly understood;
i) There has been global warming over the last several decades. The ocean is the component of the climate system that is best suited for quantifying climate system heat change [Pielke, 2003] e.g. see the figure below from NOAA’s Upper Ocean Heat Content Anomaly for their estimate of the magnitude of warming since 1993
ii) The human addition to CO2 into the atmosphere is a first-order climate forcing; e.g. see Pielke et al (2009) and the NOAA plot below
However, the Watts et al 2012 and McNider et al 2012 papers refute a major assumption in the CCSP 1.1 report
Temperature Trends in the Lower Atmosphere - Understanding and Reconciling Differences
that variations in surface temperature anomalies are random and this can be averaged to create area means that are robust measures of the average surface temperature in that region (and when summed globally, provide an accurate global land average surface temperature anomaly). Randomness, and with assumption of no systematic biases, is shown in the two papers to be incorrect.
In the chapter
Lanzante et al 2005: What do observations indicate about the changes of temperatures in the atmosphere and at the surface since the advent of measuring temperatures vertically?
they write that [highlight added]
“Currently, there are three main groups creating global analyses of surface temperature (see Table 3.1), differing in the choice of available data that are utilized as well as the manner in which these data are synthesized.
Comment: Now there is the addition of Richard Muller’s BEST analysis.
Since the network of surface stations changes over time, it is necessary to assess how well the available observations monitor global or regional temperature. There are three ways in which to make such assessments (Jones, 1995). The first is using “frozen grids” where analysis using only those grid boxes with data present in the sparsest years is used to compare to the full data set results from other years (e.g., Parker et al., 1994). The results generally indicate very small errors on multi-annual timescales (Jones, 1995). “
My Comment: The “frozen grids” combine data from poor- and well-site locations, and from different heights. A warm bias results. This is a similar type of analysis as used in BEST.
The second technique is sub-sampling a spatially complete field, such as model output, only where in situ observations are available. Again the errors are small (e.g., the standard errors are less than 0.06C for the observing period 1880 to 1990; Peterson et al., 1998b).
My Comment: Again, there is the assumption that no systematic biases exist in the observations. Poorly sited locations are blended with well-sited locations which, based on Watts et al (2012), artificially elevates the sub-sampled trends.
The third technique is comparing optimum averaging, which fills in the spatial field using covariance matrices, eigenfunctions or structure functions, with other analyses. Again, very small differences are found (Smith et al., 2005). The fidelity of the surface temperature record is further supported by work such as Peterson et al. (1999) which found that a rural subset of global land stations had almost the same global trend as the full network and Parker (2004) that found no signs of urban warming over the period covered by this report.
My Comment: Here is where the assumption that the set of temperature anomalies are random is presented. Watts et al (2012) provide observational evidence, and McNider et al (2012) present theoretical reasons, why this is an incorrect assumption.
Since the three chosen data sets utilize many of the same raw observations, there is a degree of interdependence. Nevertheless, there are some differences among them as to which observing sites are utilized. An important advantage of surface data is the fact that at any given time there are thousands of thermometers in use that contribute to a global or other large-scale average. Besides the tendency to cancel random errors, the large number of stations also greatly facilitates temporal homogenization since a given station may have several “near-neighbors” for “buddy-checks.” While there are fundamental differences in the methodology used to create the surface data sets, the differing techniques with the same data produce almost the same results (Vose et al., 2005a).
My Comment: There statement that there is “the tendency to cancel random errors” is shown in the Watts et al 2012 and McNider et al 2012 papers to be incorrect. This means their claim that “the large number of stations also greatly facilitates temporal homogenization since a given station may have several “near-neighbors” for “buddy-checks.” is erroneously averaging together sites with a warm bias.
Bottom Line Conclusion: The Watts et al 2012 and McNider et al 2012 papers have presented the climate community with evidence of major systematic warm biases in the analysis of multi-decadal land surface temperature anomalies by NCDC, GISS, CRU and BEST. The two paper also help explain the discrepancy seen between the multi-decadal temperature trends in the surface and lower tropospheric temperature that was documented in
Klotzbach, P.J., R.A. Pielke Sr., R.A. Pielke Jr., J.R. Christy, and R.T. McNider, 2009: An alternative explanation for differential temperature trends at the surface and in the lower troposphere. J. Geophys. Res., 114, D21102, doi:10.1029/2009JD011841.
Klotzbach, P.J., R.A. Pielke Sr., R.A. Pielke Jr., J.R. Christy, and R.T. McNider, 2010: Correction to: “An alternative explanation for differential temperature trends at the surface and in the lower troposphere. J. Geophys. Res., 114, D21102, doi:10.1029/2009JD011841″, J. Geophys. Res., 115, D1, doi:10.1029/2009JD013655.
I look forward to discussing the conclusions of these two studies in the coming weeks and months.